class Field_layout
A PlantCV-Geospatial object class.
class plantcv.geospatial.Field_layout
Field_layout is a class used to store parameters of a field planting strategy. These parameters can then be used in automatic plot boundary shapefile creation, such as using plantcv.geospatial.create_shapes.auto_grid and plantcv.geospatial.create_shapes.grid_from_coords.
An instance of the Field_layout class called "field_layout" is initiated on importing PlantCV-Geospatial. We recommend filling in known parameters of your field as a first step in creating an analysis workflow (see example below). This is similar to how plantcv uses params in many functions if you are already familiar with the main plantcv package.
Attributes
Attributes are accessed as field_layout.attribute.
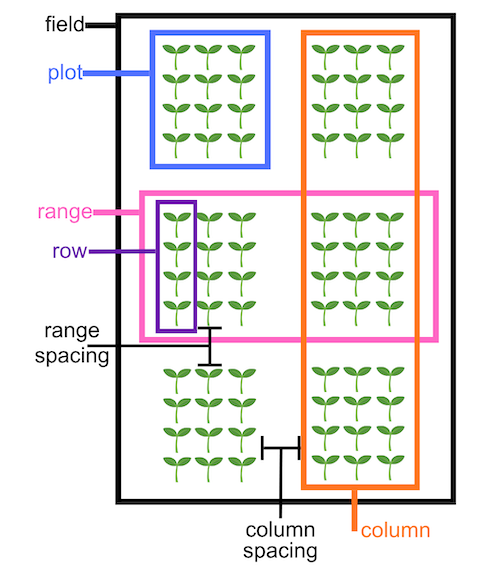
num_ranges: Integer number of ranges containing plots in your field.
num_columns: Integer number of columns containing plots in your field
range_length: Size of each range of plots. Units (meters for example) should match the units of any shapefile you intend to use to designate plot boundaries.
row_length: Size of each row within a plot. Units (meters for example) should match the units of any shapefile you intend to use to designate plot boundaries.
num_rows: Integer number of rows in each plot.
range_spacing: Size of the alley in between ranges of plots. Units (meters for example) should match the units of any shapefile you intend to use to designate plot boundaries.
column_spacing: Size of alley in between columns of plots. Units (meters for example) should match the units of any shapefile you intend to use to designate plot boundaries.
Example diagram of a field layout with attributes labeled
- Example use:
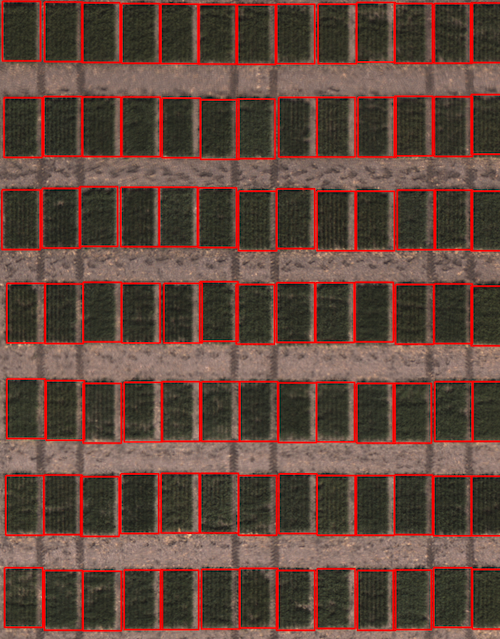
- Example image from the Bison-Fly: UAV pipeline at NDSU Spring Wheat Breeding Program below.
import plantcv.geospatial as gcv

# Set field parameters
gcv.field_layout.range_length = 3.65
gcv.field_layout.row_length = 0.9

# Read geotif in
ortho1 = gcv.read_geotif(filename="./data/example_maize_img.tif", bands="b,g,r,RE,NIR")
# Create plots using parameter values in field_layout
figure = gcv.create_shapes.grid_from_coords(img=ortho1, field_corners_path="bounds.geojson",
            plot_geojson_path="plot_points.geojson",
            out_path="gridcells.geojson")
Source Code: Here