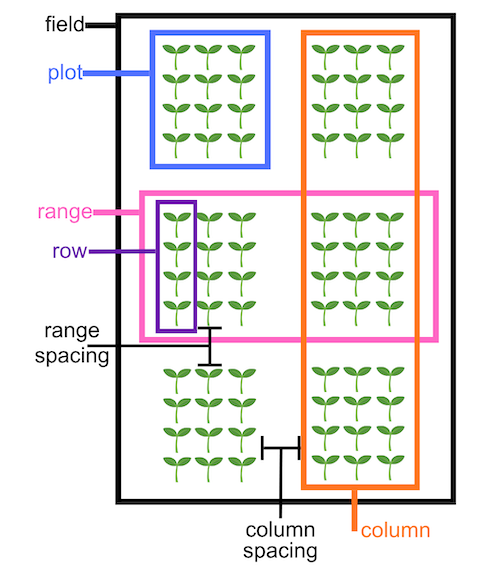
Create plot boundaries from input coordinates
plantcv.geospatial.create_shapes.grid_from_coords(img, field_corners_path, plot_geojson_path, out_path, ids=None, **kwargs)
returns figure
-
Parameters:
- img - GEO image object, used for plotting a debug image, likely read in with
geo.read_geotif - field_corners_path - Path to GeoJSON/shapefile containing four corner points (used to determine polygon directions, and the output CRS)
- plot_geojson_path - Path to geojson containing plot corner points
- out_path - Path to save the geojson shapefile. Should be ".geojson" file type.
- **kwargs
- range_length - Vertical dimension of each plot, in units matching the coordinate system of the
field_corners_path.Defaults to therange_lengthattribute of theField_layoutclass. - row_length - Horizontal dimension of each plot, in units matching the coordinate system of the
field_corners_path. Defaults to therow_lengthattribute of theField_layoutclass. - num_rows - Number of rows per plot. Defaults to the
num_rowsattribute of theField_layoutclass.
- range_length - Vertical dimension of each plot, in units matching the coordinate system of the
- img - GEO image object, used for plotting a debug image, likely read in with
-
Context:
- Helpful for precision planters without GPS
- Example use:
- Example image from the Bison-Fly: UAV pipeline at NDSU Spring Wheat Breeding Program below.
import plantcv.geospatial as gcv

# Read geotif in
ortho1 = gcv.read_geotif(filename="./data/example_maize_img.tif", bands="b,g,r,RE,NIR")
# Create and visualize GeoJSON of plots
figure = gcv.create_shapes.grid_from_coords(img=ortho1, field_corners_path="bounds.geojson",
            plot_geojson_path="plot_points.geojson",
            out_path="gridcells.geojson",
            range_length=3.6576, row_length=0.9144,
            num_rows=8)
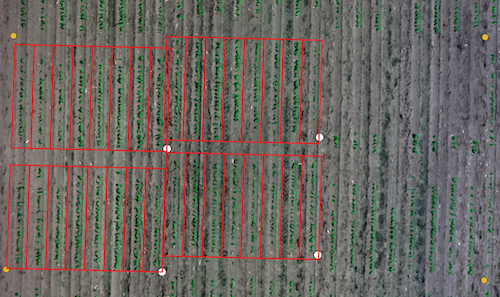
Example GeoJSON inputs & outputs explained
field_corners_path here is represented with yellow points, plot_geojson_path with white points, and the resulting out_path="gridcells.geojson" is shown in red. Note that the plot_geojson_path points are in the bottom right corner of each grid cell, so the field_corners_path points are collected starting in the bottom right corner and moving clockwise.
import plantcv.geospatial as gcv

# Read geotif in
ortho2 = gcv.read_geotif(filename="./data/example_wheat_img.tif", bands="R,G,B")
# Create and visualize GeoJSON of plots
figure2 = gcv.create_shapes.grid_from_coords(img=ortho2, field_corners_path="wheat_bounds.geojson",
            plot_geojson_path="wheat_plots.geojson",
            out_path="wheat_cells.geojson",
            range_length=2.5, row_length=1.6,
            num_rows=1)
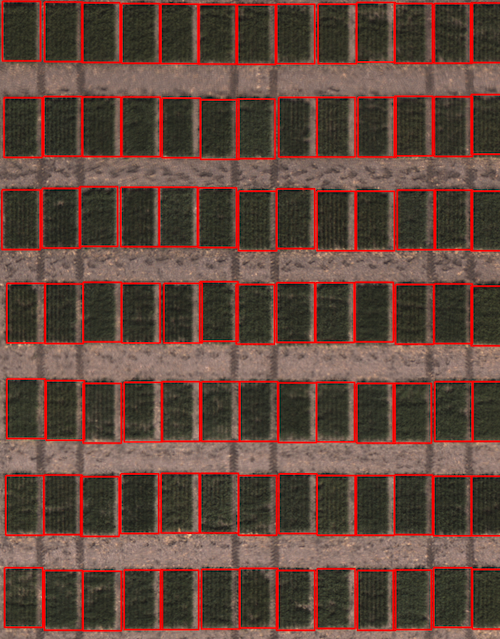
Example GeoJSON debug image
Source Code: Here