Analyze height for regions in a geojson shapefile using a canopy height model (CHM)
Vectorize approach to height estimation per region in a shapefile using a canopy height model. Calculated from geo.subtract_dsm, a canopy height model is estimated by subtracting a bare-ground DSM from a DSM with plants included.
plantcv.geospatial.analyze.chm(dsm, geojson, bins=10, label=None)
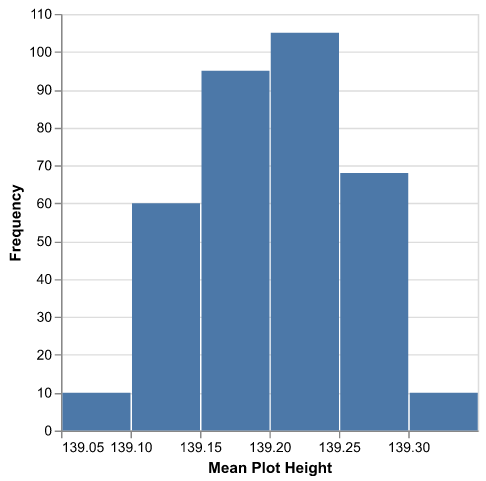
returns Histogram of average height values per plot.
-
Parameters:
- dsm - DSM image object representing a canopy height model (CHM) from
geo.subtract_dsm - bins - Number of height bins to calculate for the per-plot height distribution
- geojson - Path to the shapefile/GeoJSON containing the plot boundaries. Can be Polygon or MultiPolygon geometry.
- label - Optional label parameter, modifies the variable name of observations recorded. Can be a prefix, or list (default =
pcv.params.sample_label)
- dsm - DSM image object representing a canopy height model (CHM) from
-
Context:
- This function will utilize the geojson's
IDattribute forOutputslabels if available. - Output data stored: Data ('height_mean', 'height_std', and binned height frequencies) automatically get stored to the
Outputsclass when this function is run. These data can be accessed during a workflow (example below). For more detail about data output see Summary of Output Observations.
- This function will utilize the geojson's
-
Example use:
- Example images and geojson from the Bison-Fly: UAV pipeline at NDSU Spring Wheat Breeding Program below.
import plantcv.geospatial as gcv
import plantcv.plantcv as pcv

# Read in dsm as geotif
dsm_bareground = gcv.read.geotif(filename="./data/timepoint_0.tif", bands=[0])
dsm_withplants = gcv.read.geotif(filename="./data/timepoint_1.tif", bands=[0])

# Calculate Canopy Height Model
chm = gcv.subtract_dsm(dsm_withplants, dsm_bareground)

# Analyze coverage for each region in the geojson
dist = gcv.analyze.chm(dsm=chm,
                           geojson="./shapefiles/experimental_plots.geojson",
                           bins=25,
                           label="plot")

# To access individual observation values:
print(pcv.outputs.observations["plot_0"]["height_mean"]["value"])
Source Code: Here