Automatically create a grid of cells from a field layout
plantcv.geospatial.create_shapes.auto_grid(img, field_corners_path, out_path, ids=None, **kwargs)
returns figure
-
Parameters:
- img - GEO image object, used for plotting a debug image, likely read in with
geo.read_geotif - field_corners_path - Path to GeoJSON/shapefile containing four corner points (used to determine polygon directions, and the output CRS)
- out_path - Path to save the geojson shapefile. Should be ".geojson" file type.
- ids - Optional IDs to label the geojson plots.
- **kwargs - Other keyword arguments
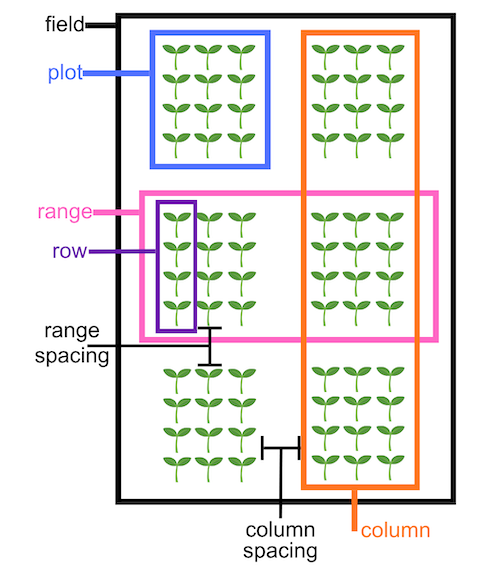
- num_ranges - Number of ranges to get created. Defaults to the
num_rangesattribute of theField_layoutclass. - num_columns - Number of columns to get created. Defaults to the
num_columnsattribute of theField_layoutclass. - range_length - Length of each grid cell in the horizontal direction, in units matching the coordinate system of the
field_corners_path. Defaults to therange_lengthattribute of theField_layoutclass. - row_length - Length of each grid cell in the vertical direction, in units matching the coordinate system of the
field_corners_path. Defaults to therow_lengthattribute of theField_layoutclass. - num_rows - Number of rows within a single plot. Defaults to the
num_rowsattribute of theField_layoutclass. - range_spacing - Length of "alley" spaces between ranges. Defaults to the
range_spacingattribute of theField_layoutclass. - column_spacing - Length of "alley" spaces between columns. Defaults to the
column_spacingattribute of theField_layoutclass.
- num_ranges - Number of ranges to get created. Defaults to the
- img - GEO image object, used for plotting a debug image, likely read in with
-
Context:
- Helpful for precision planted experiments
- Example use:
- Example image from the Bison-Fly: UAV pipeline at NDSU Spring Wheat Breeding Program below.
import plantcv.geospatial as gcv
# Read geotif in
ortho1 = gcv.read.geotif(filename="./data/example_img.tif", bands="b,g,r,RE,NIR")
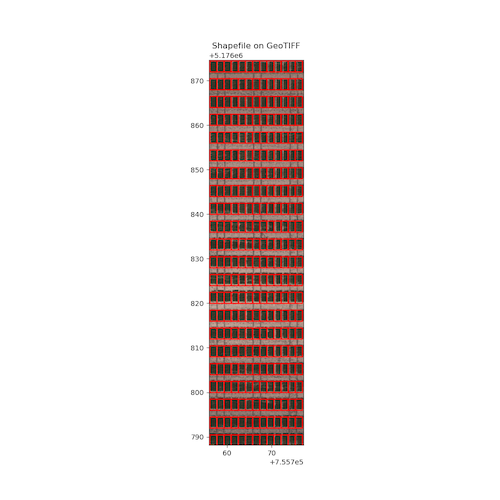
# Create and visualize GeoJSON of plots
figure = gcv.create_shapes.auto_grid(img=img, field_corners_path="bounds.geojson",
out_path="gridcells.geojson", num_ranges=22, num_columns=13,
num_rows=1, range_spacing=1.5, range_length=2.5, row_length=1.6)
Example GeoJSON output figure
Source Code: Here