Analyze color for regions in a geojson shapefile
Vectorized approach to color stats and histograms per region in a shapefile using a binary mask.
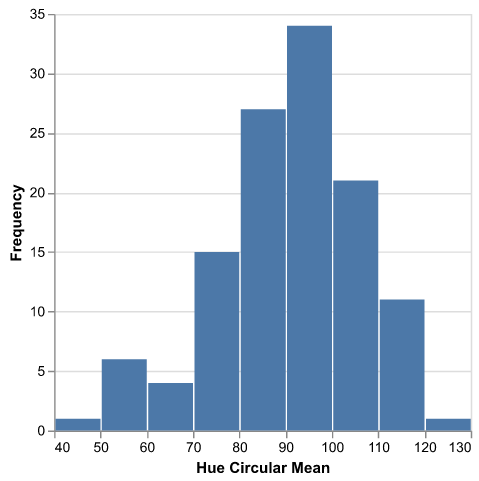
plantcv.geospatial.analyze.color(img, bin_mask, geojson, bins=10, colorspaces="hsv", label=None)
returns Debug histogram of hue circular mean across plots.
-
Parameters:
- img - GEO image object, likely read in with
gcv.read_geotif - bin_mask - Binary mask, numpy array
- geojson - Path to the shapefile/GeoJSON containing the plot boundaries. Can be Polygon or MultiPolygon geometry.
- img - GEO image object, likely read in with
-
Context:
- Output data stored: Data ('mean', 'std', 'counts', 'bin_edges') for each specified channel and ('hue_circular_mean', 'hue_circular_std') for each plot automatically gets stored to the
Outputsclass when this function is run. These data can be accessed during a workflow (example below). For more detail about data output see Summary of Output Observations.
- Output data stored: Data ('mean', 'std', 'counts', 'bin_edges') for each specified channel and ('hue_circular_mean', 'hue_circular_std') for each plot automatically gets stored to the
import plantcv.geospatial as gcv
import plantcv.plantcv as pcv

# Read geotif in
ortho1 = gcv.read_geotif(filename="./data/example_img.tif", bands="b,g,r,RE,NIR")
# Create or read in a binary mask
# Analyze coverage for each region in the geojson
gcv.analyze.color(img=ortho1, bin_mask=plant_mask,
                           geojson="./shapefiles/experimental_plots.geojson")

# To access individual observation values:
print(pcv.outputs.observations["default_1"]["hue_circular_mean"]["value"])
Source Code: Here