Analyze spectral index signatures for regions in a geojson shapefile using zonalstats
Vectorized approach to spectral index analysis per region in a shapefile.
plantcv.geospatial.analyze.spectral_index(img, geojson, index, mask=None, percentiles=None, label=None, distance=20)
returns Debug image with regions drawn on the input index.
-
Parameters:
- img - GEO image object, likely read in with
gcv.read_geotif - geojson - Path to the shapefile/GeoJSON containing the plot boundaries. Can be Polygon or MultiPolygon geometry.
- index - spectral index to calculate and analyze. Must be an available index from PlantCV; see full list here.
- mask - binary mask indicating which pixels should be used to calculate statistics. Defaults to None.
- percentiles - Iterable of numeric percentiles [0-100]. 0 and 100 are automatically included (default =
None, whererange(0, 101, 25)is used) - label - Optional label parameter, modifies the variable name of observations recorded. Can be a prefix, or list (default =
pcv.params.sample_label) - distance - Amount of flexibility (in nanometers) regarding the bands used to calculate an index.
- img - GEO image object, likely read in with
-
Context:
- This function will utilize the geojson's
ID(orFID) attribute forOutputslabels if available andlabel=None. - Providing a binary mask where you have segmented plants is useful if you do not want to average a spectral index over both plant and soil values, such as for individual plants or when canopy coverage is not complete.
- Output data stored: Data (index minimum, maximum, mean, median, standard deviation, percentile_25, and percentile_75) automatically gets stored to the
Outputsclass when this function is run. These data can be accessed during a workflow (example below). For more detail about data output see Summary of Output Observations.
- This function will utilize the geojson's
-
Example use:
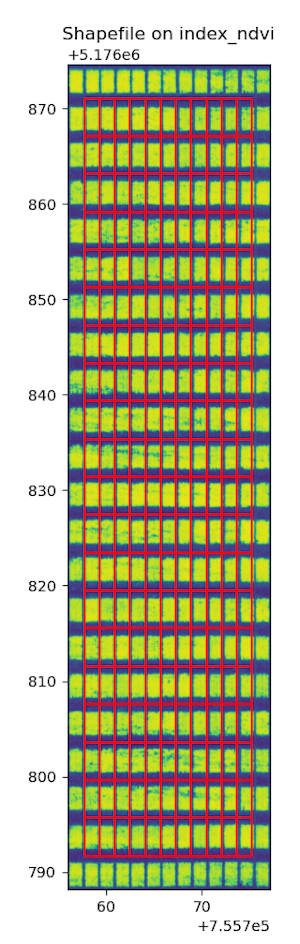
- Example images and geojson from the Bison-Fly: UAV pipeline at NDSU Spring Wheat Breeding Program below.
import plantcv.geospatial as gcv
import plantcv.plantcv as pcv

# Read in multiband image as geotif
img = gcv.read.geotif(filename="./data/EX_8_DAP_46_2021_Casselton_YT_06-22_5band.tif", bands="b,g,r,RE,NIR")

# calculate NDVI for example
bounds = gcv.analyze.spectral_index(img=img,
                           geojson="./Shapefiles/shapefile.shx",
                           index = "ndvi"
                           label=None)

# To access individual observation values:
print(pcv.outputs.observations['default_1']['mean_index_ndvi']['value'])
Source Code: Here