Analyze coverage for regions in a geojson shapefile
Vectorize approach to pixel count and percent coverage per region in a shapefile using a binary mask.
plantcv.geospatial.analyze.coverage(img, bin_mask, geojson)
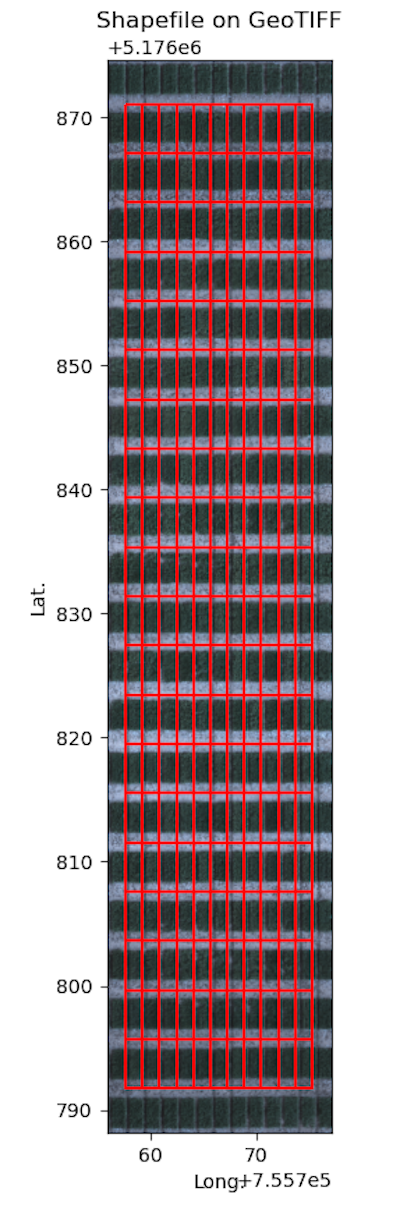
returns Debug image with regions drawn on the input image.
-
Parameters:
- img - GEO image object, likely read in with
gcv.read_geotif - bin_mask - Binary mask, numpy array
- geojson - Path to the shapefile/GeoJSON containing the plot boundaries. Can be Polygon or MultiPolygon geometry.
- img - GEO image object, likely read in with
-
Context:
- This function will utilize the geojson's
IDattribute forOutputslabels if available. - Output data stored: Data ('pixel_count', 'coverage', 'percent_coverage') automatically gets stored to the
Outputsclass when this function is run. These data can be accessed during a workflow (example below). For more detail about data output see Summary of Output Observations.
- This function will utilize the geojson's
-
Example use:
- Example images and geojson from the Bison-Fly: UAV pipeline at NDSU Spring Wheat Breeding Program below.
import plantcv.geospatial as gcv
import plantcv.plantcv as pcv

# Read geotif in
ortho1 = gcv.read_geotif(filename="./data/example_img.tif", bands="b,g,r,RE,NIR")
# Create or read in a binary mask
# Analyze coverage for each region in the geojson
vis = gcv.analyze.coverage(img=ortho1, bin_mask=plant_mask,
                           geojson="./shapefiles/experimental_plots.geojson")

# To access individual observation values:
print(pcv.outputs.observations["default_0"]["percent_coverage"]["value"])
Source Code: Here