ROIs from the center of gridded polygons
After using a Napari viewer, and possibly the combination of create_shapes.napari_grid and create_shapes.napari_polygon_grid, this function takes a viewer's shapes layer and turns the center point of every polygon into a circular Region of Interest (ROI) for downstream analysis of individual objects.
plantcv.geospatial.center_grid_rois(editor, radius=10, layername="Shapes")
returns roi_objects
-
Parameters:
- editor -
InteractiveShapesclass object. - radius - Pixel value of the radius of ROIs. Default is 10.
- layername - Name of shape layer containing polygons, defaults to "Shapes".
- editor -
-
Context:
- Though this function is designed to be used after drawing polygons in a grid using
create_shapes.napari_gridandcreate_shapes.napari_polygon_grid, it can be used to draw ROIs using polygons formed by hand, read in from a shapefile, or drawn using custom algorithms.
- Though this function is designed to be used after drawing polygons in a grid using
-
Example use:
- Below is an example of using hand-drawn polygons. For an example of making grid polygons, see InteractiveShapes Documentation
import plantcv.plantcv as pcv
import plantcv.geospatial as gcv
pcv.params.debug = "plot"
# Read geotif in
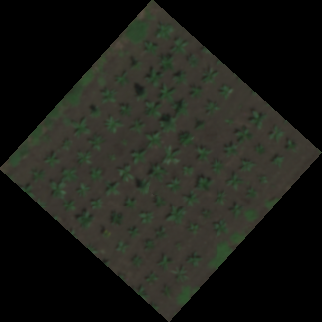
img = gcv.read_geotif("./grid_field.tif", bands="B,G,R,RE,N")
# Add a shapes layer to your InteractiveShapes editor
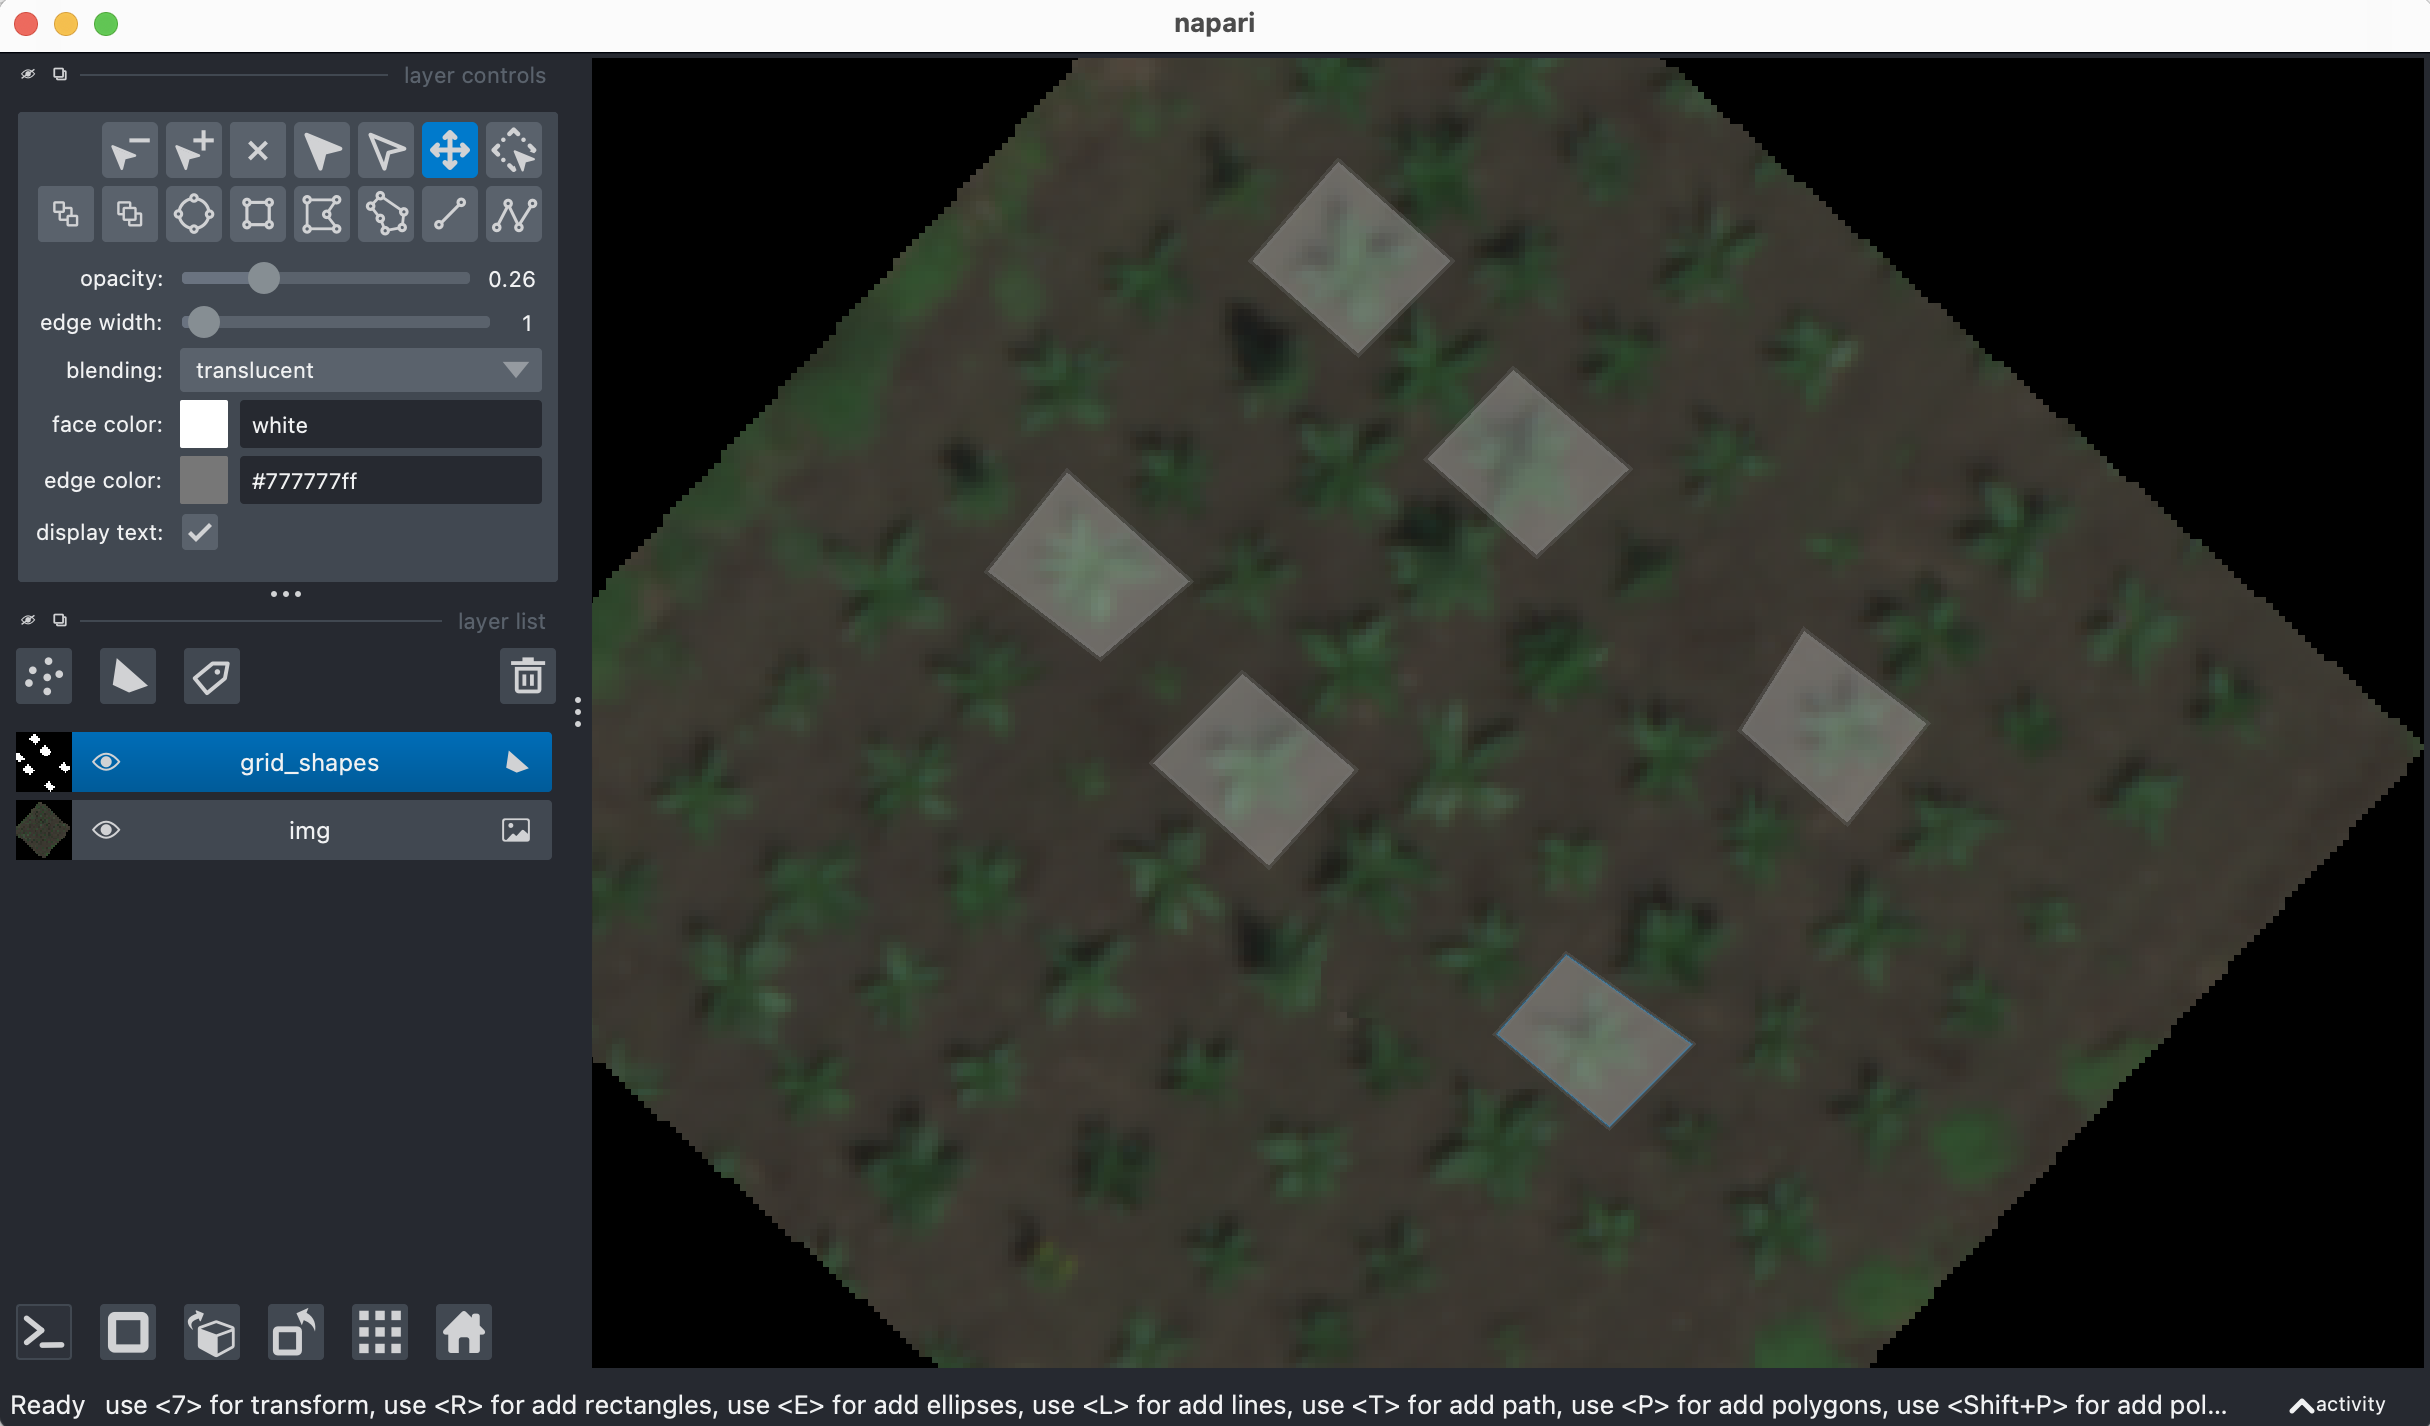
editor = gcv.create_shapes.InteractiveShapes(img)
editor.add_layer()
# Now, when the Napari viewer opens, the user can add polygons around individual plants or plots.
# Draw ROIs
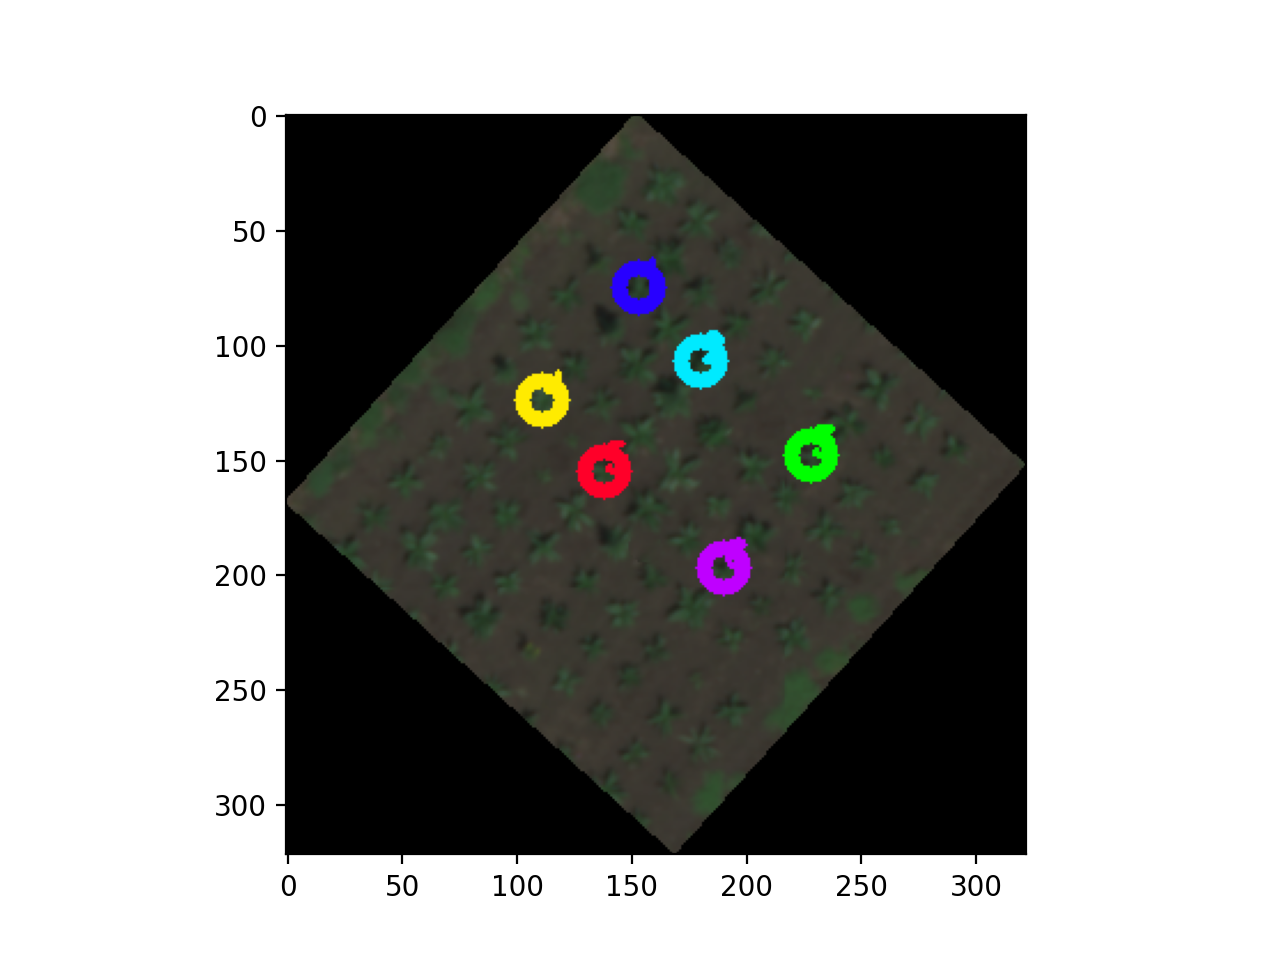
rois = gcv.center_grid_rois(editor, radius=9)
# Resulting ROIs can be used for downstream analysis of individual objects in PlantCV
Read in geotif:
Adding polygons to shapes layer:
Drawn ROIs:
Source Code: Here